From Manufacturers to the Shelf: How Retail Audit Measurement Reveals the Real FMCG Price Landscape in Ghana

When people talk about “the price” of an FMCG product, they usually mean one number. In reality, a single product carries several different prices as it moves through the supply chain, and the gap between those prices explains a lot about why some products sell well and others don’t. SumsureIQ’s retail audit measurement service, sRetailIQ, exists precisely to track this. It collects data directly from retail outlets on what’s stocked, purchased, priced, and displayed, so that manufacturers and suppliers can set appropriate prices for their SKUs based on what is actually happening on the shelf, not just what is happening on their invoices.

The FMCG Price Chain

A simplified chain looks like this:

Manufacturer/Importer → Distributor → Wholesaler → Retailer → Consumer

At each stage, a different price applies:

Price typeWho pays whomIllustrative example
Manufacturer/Supplier priceDistributor buys from manufacturerGHS 180/carton
Distributor/trade priceDistributor sells to wholesaler/retailerGHS 195/carton
Wholesale priceWholesaler sells to retailerGHS 210/carton
Retail/shelf priceRetailer sells to consumerGHS 240/carton
Unit/consumer priceConsumer buys one SKUGHS 10/pack
Promotional priceConsumer buys on promotionGHS 8.50 (from GHS 10)
RRP/list priceSupplier’s recommended priceGHS 10
Price per standard unitPrice normalised by quantityGHS 20/kg

(These figures are illustrative, not SumsureIQ-reported prices.)

Manufacturer/Supplier price covers production cost plus manufacturer margin, useful for understanding a manufacturer’s economics, but not the price a retail audit actually observes.

Distributor/trade price adds logistics and distributor margin on top of the supplier price.

Wholesale price adds the wholesaler’s costs and margin as the product moves to the retailer.

Retail/shelf price is where SumsureIQ’s field auditors focus, visiting outlets to record stock, purchases, pricing, and placement. This shelf price is the market-facing figure that matters most for answering “what are real average prices in the market?”, grounded in what’s on the shelf rather than manufacturers’ sales reports.

Actual consumer/transaction price can differ from the shelf price once promotions are applied, an important distinction when analysing price elasticity, since SumsureIQ’s services explicitly assess promotional cost efficiency and market impact alongside pricing.

RRP vs Reality

A manufacturer might set a recommended retail price (RRP) of GHS 10.25 sometimes printed on the product itself, but the actual market can look very different:

  • Shop A: GHS 12
  • Shop B: GHS 11.50
  • Shop C: GHS 13
  • Shop D: GHS 10.50

This is exactly why retail audit data matters: rather than assuming the RRP reflects reality, SumsureIQ tracks observed prices across outlets, channels, and regions to give a true picture.

Promotions Can Mislead Simple Comparisons

BrandNormal pricePromotional price
Brand AGHS 12GHS 10
Brand BGHS 11GHS 11
Brand CGHS 13GHS 10.50

Looking only at shelf prices in a snapshot might suggest Brand A is cheapest. But once promotions end, Brand B becomes the actual cheapest option, a reminder that price comparisons need context, not just numbers.

Price Per Standard Weight: A Core Concept

One of the most important ideas in SumsureIQ’s research is price per standard base weight, which explains why consumers often favour medium or larger packs:

  • Small pack: 250g for GHS 7 → GHS 28/kg
  • Medium pack: 500g for GHS 12 → GHS 24/kg
  • Large pack: 1kg for GHS 21 → GHS 21/kg

Even though the 1kg pack has the highest sticker price, it delivers more product per cedi, which is part of why SumsureIQ has observed a consumer shift toward medium-to-large pack sizes seeking better value.

This extends into pack-price architecture, how a brand prices its full range of pack sizes:

SKUPackRetail pricePrice/kg
A250gGHS 7GHS 28
B500gGHS 12GHS 24
C1kgGHS 21GHS 21
D2kgGHS 40GHS 20

Consumers increasingly ask “which pack gives me the most value?” rather than simply “which is cheapest?”, and SumsureIQ’s 2026 research on why some FMCG products fail to move specifically points to misaligned pack-price architecture as a structural cause.

Premium vs Value Positioning

Price also signals market positioning:

PositioningExample price
Economy/valueGHS 8
MainstreamGHS 10
PremiumGHS 15
Super-premiumGHS 20

SumsureIQ’s 2025 research pointed to premiumisation trends in Ghana’s FMCG market, with value sales growing faster than volume sales and new products commanding higher prices per standard weight.

How Inflation Moves Through the Chain

Currency and cost pressures ripple down the entire chain:

Cedi depreciates → imported inputs cost more → manufacturer’s production cost rises → trade price rises → distributor/wholesaler costs rise → shelf price rises → consumer pays more

SumsureIQ’s analysis notes that a weaker local currency raises the cost of imported raw materials and finished goods, costs manufacturers may pass through to consumers, and that rising transportation costs also feed into retail prices.

A Worked Example

StagePrice/pack
Production costGHS 6.00
Manufacturer/Supplier priceGHS 7.50
Distributor priceGHS 8.50
Wholesale priceGHS 9.50
RRPGHS 12.00
Shelf priceGHS 12.00
Promotional priceGHS 10.50
Price/kg (normal)GHS 24
Price/kg (promo)GHS 21

Supply-chain view: GHS 7.50 → 8.50 → 9.50 → 12.00 Consumer view: GHS 12.00 normal → GHS 10.50 promotional

A retail audit adds a third lens entirely: average price by region and channel, competitor pricing, price per standard weight, best-value pack size, promotional frequency, price trends over time, distribution adequacy, and whether price explains why a product is or isn’t moving. This reflects SumsureIQ’s monthly retail audit methodology, which covers thousands of observations across FMCG categories, regions, and store types.

Three Levels of Price

A. Supply-chain prices: manufacturer/supplier, distributor/trade, wholesale B. Market/retail prices: RRP, shelf price, promotional price, actual transaction price C. Analytical prices: price per unit, average retail price, price index, price premium/discount vs. competitors, price by pack size, price by channel/region

SumsureIQ supports clients on Level A pricing decisions, but its real value lies in Levels B and C: understanding what’s actually happening in the market rather than relying on invoice prices alone.

Why FMCG Brands Trust SumsureIQ

Whether launching a product, entering a new market, or defending market share, accurate and timely data is essential. SumsureIQ has built its reputation on precision, promptness, and prudence, backed by a research team with deep experience across African and European markets. Combining a country-wide field presence with a proven three-pillar research model and an expanding African footprint, SumsureIQ gives FMCG brands a 360-degree view of what’s happening on the shelf, why it’s happening, and how to respond strategically.

SumsureIQ: The IQ behind the data.

As African consumer markets grow, so does the demand for high-quality market intelligence. SumsureIQ meets that demand with research tailored to African market realities while holding to rigorous international standards, positioning it as a genuine strategic growth partner, not just another research agency.

To leverage real-time retail audit and consumer data for your categories and brands, visit sumsureiq.com.

#SumsureIQ #FMCG #FMCGSector #MarketResearch #DataStrategy #ConsumerInsights #RetailAuditMeasurements #DataAnalytics #BusinessIntelligence #Africa #Innovation #MarketInsights #DataDrivenDecisionMaking 
SumsureIQ: The IQ Behind Data-Driven Growth and decision making in the FMCG Sectors of African Countries 

The Fast-moving consumer goods (FMCG) industry in African Countries is one of the continent’s most competitive and fastest-evolving spaces. Brands are fighting for shelf space, market share, and consumer loyalty across thousands of outlets, from busy urban supermarkets to small neighborhood shops in the most remote corners of each country. In such dynamic markets, decisions can no longer be based on guesswork or outdated reports. They need to be based on real-time, source-level data. This is exactly where SumsureIQ has positioned itself as the trusted intelligence partner for FMCG brands across Ghana and other African countries.

What is SumsureIQ?

SumsureIQ is a full-service market research agency registered in Ghana, built by a team whose members bring decades of combined experience working with clients across African and European markets. Since its founding, SumsureIQ has grown into what it calls itself proudly on its own platform, the top FMCG market research company. SumsureIQ has worked and advised multinational and local companies in Ghana, Nigeria, Cameroon, Ivory Coast and other African countries.

The agency’s tagline says it all: “The IQ behind the data.” It’s more than a slogan, it reflects a company culture built around turning raw numbers into intelligence that businesses can actually act on. SumsureIQ does not just collect data; it partners with clients from the idea-generation stage all the way through to impact measurement, following up to understand how findings are put to work to help brands win in the market.

A Country-Wide Network of Field Agents and Auditors

What truly sets SumsureIQ apart is its boots-on-the-ground approach. While many research firms rely on limited samples or desk-based estimates, SumsureIQ deploys a country-wide network of trained field auditors who move through outlets, markets, and retail channels to capture what is actually happening at the point of sale on a monthly basis. These field teams are responsible for:

  • Outlet audits and assessments – verifying stock, shelf presence, and product visibility and availability.
  • Retailer engagement – building relationships that improve data quality and access
  • Consumer engagement  – to understand preferences and reasons behind buying and consumption behaviour 
  • Competitor analysis – tracking rival brands’ pricing, distribution, and shelf activity
  • Data accuracy and verification – ensuring every data point reflects reality, not assumption

This nationwide field footprint means SumsureIQ can answer questions that matter to FMCG decision-makers with precision: 

Which regions is a brand missing from? 

What are the real average prices in the market? 

How well is a product distributed across channels? 

What flavour is the most preferred? 

Why do consumers buy a particular brand? 

Because the data comes directly from the shelf, consumer and the shopper, not from projections, clients get a picture of the market they can trust.

And this capability does not stop at Ghana’s borders. SumsureIQ has extended the same rigorous, field-driven methodology into other African markets, giving multinational and regional FMCG brands a consistent, comparable view of performance across the continent, a rare capability among research providers operating in the region.

Three Pillars of Research Excellence

SumsureIQ’s work is built around three core service lines, each designed to answer a different category of business question.

1. sRetailIQ is the agency’s retail audit measurement service. Every month, field teams collect data directly from the field (from the same retail outlets). These data show exactly how products are being purchased, stocked, priced and displayed in the real retail environment. These data are then used to measure, via robust mathematical, Statistical and Econometric Methods for a myriad of Key Performance Indicators (KPIs) as well as performance brand coverage analysis and assessment, not just what appears in sales reports. sRetailIQ answers the “what” and “which” questions: What is the market size? What is my brand’s share? Which channels and regions still hold untapped opportunities for growth?

2. sConsumerIQ goes a layer deeper, tapping into consumer panels, groups of shoppers who regularly share their buying habits, preferences, and product usage over time. This service answers the “why,” “how,” and “who” questions that retail data alone cannot: Why is a brand losing sales? How can a business capture a specific segment of the population? Who are the most loyal customers for a given brand?

3. sConsultancyIQ rounds out the offering with bespoke consultancy in economics, statistics, and data science, covering big data analysis, AI-driven census and survey execution, data engineering, and machine learning and AI-driven analytics and AI-driven Route-to-Market (RtM) planning, execution and analysis for clients who need more advanced modeling and understanding of their market.

Together, these three services give FMCG brands a 360-degree view: what is happening on the shelf, why it’s happening, and how to respond strategically.

Why FMCG Brands Trust SumsureIQ

For any FMCG company,  whether launching a new product, entering a new market, or defending market share against competitors, the value of accurate, timely data cannot be overstated. SumsureIQ has built its reputation on exactly this promise: precision, promptness and prudence. These qualities are backed by a team with a genuinely deep bench of research experience across African and European markets.

By combining a country-wide field presence, a proven three-pillar research model, and an expanding footprint across many African countries, SumsureIQ has earned its place as more than just another research agency. It has become a strategic growth partner for FMCG brands that want to compete and WIN, using data-driven decisions rather than guesswork. SumsureIQ is “The IQ behind the data”.

Driving Growth Across Africa

As the consumer markets in African countries continue to grow, demand for high-quality market intelligence is also growing. SumsureIQ is helping meet this demand by providing research solutions tailored to the realities of African markets while maintaining rigorous international standards. Its commitment to accuracy, innovation, and client partnership positions the company as an important contributor to the future of data-driven business across the continent.

For organisations seeking to understand markets more clearly, strengthen competitive positioning, and make smarter strategic decisions, SumsureIQ demonstrates how quality research can become a powerful catalyst for sustainable growth.

Questions?

Are your brands in the consumers’ shopping basket in this seemingly economic recovery and growth landscape in African countries? Do you want to know more about your brands and categories performance,  that of your competition and how consumers view your brands? 

Are you a manufacturer, a supplier, a stakeholder or a player in the FMCG market in any African country? Are you leveraging real-time retail measurement insights to scale your business for growth?

If you wish to leverage real-time retail audit measurement and consumer data to improve your categories and brands performances, SumsureIQ is ready to have a discussion with you.

Contact us by visiting our website at www.sumsureiq.com

#SumsureIQ #FMCG #FMCGSector #MarketResearch #ConsumerInsights #RetailAuditMeasurements #DataAnalytics #BusinessIntelligence #Africa #Innovation #MarketInsights #DataDrivenDecisionMaking #DataStrategy
Consumer goods sector bounces back with 3.7% growth in first half of 2026 – FMCG

The Fast-Moving Consumer Goods (FMCG) sector in Ghana has recorded improved performance in the first half of 2026, according to new research by SumsureIQ, a leading market and economic research agency based in Ghana.

The findings indicate that volume sales and consumption in the FMCG sector grew by 3.7 per cent between January and June 2026 compared to the same period in 2025.

This recovery comes amid a challenging economic landscape characterised by declining inflation rates, though consumer prices remain sticky and exchange rate volatility persists.

Food products drive growth

Food products accounted for the bulk of the increase in volume consumption, contributing approximately 79 per cent of the growth. Non-alcoholic beverages followed with 12 per cent, alcoholic beverages with six per cent and non-food items with three per cent.

In terms of value, the actual amount consumers spent, FMCG consumption surged by 21.9 per cent during the review period compared to the first half of 2025.

Food consumption again emerged as the primary driver, accounting for 48 per cent of the value increase. Alcoholic beverages surprisingly contributed 39 per cent, while non-alcoholic beverages and non-food items accounted for 11 per cent and two per cent respectively.

Consumer preference shifts

The research identified the top 15 performing brands across various categories based on in-store transaction numbers at the Point-of-Sale (POS).

In the food category, popular brands included Onga, Kivo, Maggi, Nido, Ideal, Indomie, Remie, Carnation, Sankofa, Lyzy, Minazen, Tasty-Tom, Frytol, Kremela and Cowbell.

Non-alcoholic beverage consumers favoured Cowbell, Verna, Bigoo, Milo, Miksi, Voltic, Bel-Aqua, Kalyppo, Awake, Malta Guinness, This Way, Coca-Cola, Kaesar, Bel-Aqua Active and Don Simon.

Alcoholic beverage preferences included Club, Striker, Guinness, Orion, Abc, Orijin, Gulder, Castle Bridge, Star, Goal, Adonko, Club Shandy, Kiss, Faxe and Alomo.

Non-food items saw Madar, Jamaa, Pepsodent, Kleesoft, Colgate, Sunlight, Vip, Yazz, Key Soap, Day-By-Day, Nivea, Cuzy, Camel, Kdo and Lavita as the preferred brands.

Consumers seeking value for money

The founder and Chief Executive Officer of SumsureIQ, Dr Erasmus L Owusu, explained that consumers are increasingly purchasing medium to high pack-size items because these tend to have lower average prices per standard-base weight, making them more affordable.

“Small pack-sizes lend themselves to convenience but average price per standard-based weight tends to be relatively high. Consumers see these medium to high pack-sizes as better value for money propositions,” he said.

Dr Owusu noted that while inflation levels have dropped significantly, consumers have yet to feel these reductions in their pockets.

“The consequential cost-of-living crisis is abating but the transition mechanism to the consumer pockets is very slow,” he stated.

However, he acknowledged improvements in the average standard of living for Ghanaian consumers in the first half of 2026 compared to the same period in 2025.

“Consumers are consuming more food items, as well as having some extra income to spend on expensive alcoholic beverages and other items,” he noted.

Economic indicators improve

The research aligns with recent economic data showing Ghana’s inflation rate at 5.3 per cent year-on-year in June 2025, compared to 13.7 per cent in the same period of 2025, according to the Ghana Statistical Service.

Dr Owusu added that recent stability of the cedi against a basket of foreign currencies would enable consumers to make more calculated purchasing decisions going forward.

Cautious optimism

The latest SumsureIQ findings suggest potential for Ghana’s FMCG market recovery alongside broader economic recovery, with the removal of the E-Levy possibly boosting domestic consumption.

However, Dr Owusu cautioned that improvements remain cautious and tenuous, susceptible to global economic shocks.

“The recent US/Israel war on Iran and the consequential closure of the Strait of Hormuz could be a destabilising factor for the fragile recovery as this may have economic impacts affecting the FMCG sector,” he warned.

Research methodology

SumsureIQ collects over 120,000 lines of data monthly across more than 75 categories and segments of FMCG products in food, non-food, alcoholic, and non-alcoholic beverages.

The agency gathers data from 10 retail channels, including Modern Trade outlets and Petrol Marts across all 16 regions in Ghana.

Using robust mathematical, statistical, econometric methodologies and AI techniques, SumsureIQ estimates market sizes for every category, manufacturer and brand.

The company provides monthly Retail Audit Measurement Index (RAI) services, with data available from January 2023 to date.

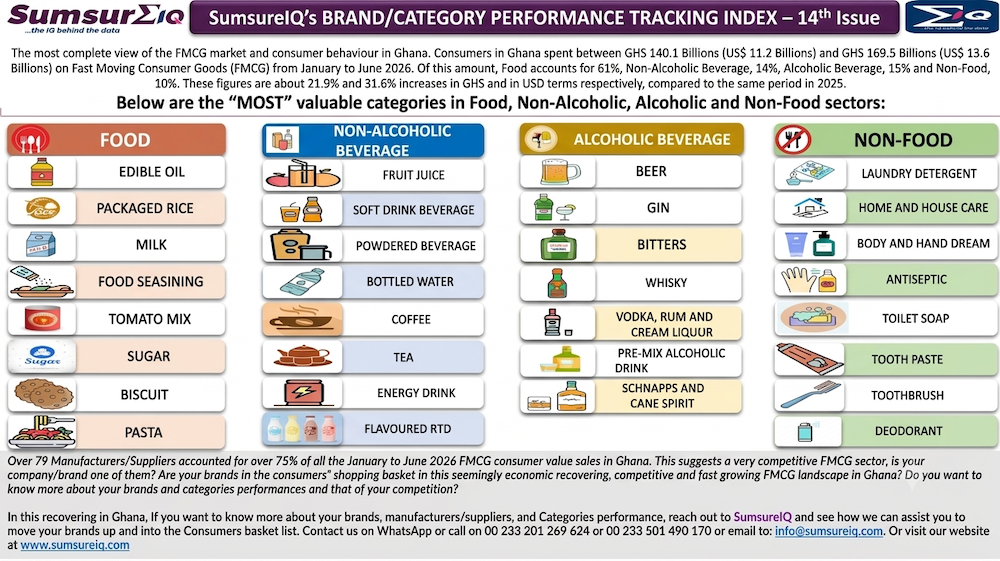
SumsureIQ Quarterly TOP 10 FMCG BRAND/CATEGORY PERFORMANCE TRACKING INDEX – 14th Edition

SumsureIQ, the IQ Behind the data, equals FMCG MARKET RESEARCH across African Countries. This means that, SumsureIQ has the most complete view of the FMCG market and consumer behaviour in Ghana.

Consumers in Ghana spent between GHS 140.1 Billions (US$ 11.2 Billions) and GHS 169.5 Billions (US$ 13.6 Billions) on Fast-Moving Consumer Goods (FMCG) from January to June 2026. These figures are about 21.9% and 31.6% increases in GHS and in USD terms respectively compared to the same period in 2025.

Of this amount, Food accounted for 61% (an increase of 2% point compared to the same period in 2025), Non-Alcoholic Beverage, 14% (a drop of -1% point compared to 2025), Alcoholic Beverage, 15% (an increase of 2% point compared to the same period in 202%) and Non-Food, 10% (a drop of -3% point compared to 2025).

These figures would suggest that, spending on Food products as a proportion of the total FMCG spending has increased. This may further suggest that, cost of living pressures are sticky, though, improving. The Food Sector represents the main driver of growth in the FMCG Market in Ghana.

The data also show that over 78 Manufacturers/Suppliers accounted for more than 75% of all the January to June 2026 FMCG consumer value sales in Ghana compared to over 49 in the same period in 2025.

This suggests a very competitive and growing market with several new entrants into the FMCG sector in a recovering economic landscape in Ghana. In general, SumsureIQ data may suggest that the Ghanaian economic landscape has improved and has become more competitive.

This is therefore, a sign of economic recovery and relative stability in the period from January to June 2026. But there is caution due to the US/Israel and Iran War as it may have some economic impacts down the line.

Questions?

Are your brands in the consumers’ shopping basket in this seemingly economic recovery landscape in Ghana? Do you want to know more about your brands and categories performance and that of your competition?

Are you a manufacturer, a supplier, a stakeholder or a player in the FMCG market in any African country? Are you leveraging real-time retail measurement insights to scale your business for growth?

If you wish to leverage real-time retail audit measurement data to improve your categories and brands performances, SumsureIQ is ready to have a discussion with you.

Contact us by visiting our website at www.sumsureiq.com

FMCGMarkertResearch #GhanaFMCG #SumsureIQ #RetailAudit #sRetailIQ #sConsumerIQ #sConsultancyIQ #MarketResearch #RetailTrends #BrandPerformance #CategoryPerformance #AfricaMarketResearch #AfricaFMCG

What are the questions necessary to spot or identify the difference between Retail Audit Measurement Index (RAI) or Store Observation Retail Tracking (SORT) research products by a provider and how to assess them?

Most people confuse Retail Audit Measurement Index (RAI) with Store Observation Retail Audit Tracking (SORT) research methodologies and outcomes because, on the surface, both involve “going to stores and collecting data.” But underneath, they are fundamentally different research methodological approaches or systems and they produce different outcomes and results. 

Further to SumsureIQ post( click here to see previous article) on the discussions of the above topic in LinkedIn on 26 May 2026, below are 17 short, sharp and high‑precision sets of questions that will instantly expose whether a provider is selling RAI or SORT. These questions are formulated specifically for the Emerging markets, especially African countries FMCG ecosystems, where many agencies blur the lines.

Each question includes what a “TRUE” RAI provider delivers and what a SORT provider will reveal (even if indirectly).

1. Do you collect quantitative SKU‑level sales data from retail outlets/stores?

  • RAI answer: Yes:- we collect SKU‑level, stock, purchases, pricing, distribution. Sales data are quantitatively measured from the collected stock and purchases data using mathematical estimations.  
  • SORT answer: No:- We collect observed sales, we observe shelves, facings, presence or availability.

2. Is your methodology a continuous monthly audit or periodic observation?

  • RAI: Yes:- we do Monthly continuous data collections and measurement.
  • SORT: No:- Periodic (weekly/bi‑weekly/monthly) store visits without continuous audit structure.

3. Do you measure numeric and weighted distribution using audited sales?

  • RAI: Yes :- we calculate both numeric and  weighted distribution figures from the sales data.
  • SORT: No :- we can only estimate numeric presence or availability.

4. Do you collect store‑level stock movement (opening stock, closing stock, sales-out)?

  • RAI: Yes :- we collect store level inventory. This is core to retail audit. We collect both forward (what is on the shelf) stock and backroom stocks
  • SORT: No :-  we only collect what is on the shelf and prices

5. Do you have a defined retail census and statistically representative sample?

  • RAI: Yes :-  we have
  1. census (universes)
  2. stratified sample (statistical sample design)
  3. national projection (statistically projected).
  • SORT: No :-  convenience or route-based store lists (no sample design, no projections).

6. Do you provide market size and share estimates?

  • RAI: Yes :- we do. Because, we have total country sales data for each category.
  • SORT: No :- we do not. Impossible without total country audited sales.

7. Do you track price architecture (RSP, promo price, pack-price ladders)?

  • RAI: Yes :- we do. Prices are some of our core metrics.
  • SORT: Yes but Limited :- We may note shelf price but not architecture.

8. Do you measure out-of-stock rates using stock movement or only shelf observation?

  • RAI: Yes :-  we do measure Stock-based OOS (accurate).
  • SORT: No:- Shelf-based OOS (inaccurate).

9. Do you collect display, visibility, and merchandising execution as secondary metrics?

  • RAI: Yes :- we do, but as add-ons to sales data.
  • SORT: Yes :- This is the primary metric for SORT

10. Does your methodology allow for statistical projections of the collected data to the total Country universe?

  • RAI: Yes :- we statistically project the data to the total country universes for each of the categories.
  • SORT: No :- we do not have the store universes.

11. Can you provide channel-level performance (Traditional Trade (TT), Modern Trade (MT), Kiosks/Mini Stores, Groceries, Petrol Marts, etc.?

  • RAI: Yes :- we can provide structured channel definitions.
  • SORT: Often No :- or may be very limited.

12. Do you integrate with a consumer panel or household consumption data?

  • RAI: Yes :- we do integrate them to explain sales drivers.
  • SORT: No :- we don’t measure sales. We have observed sales.

13. Do you produce monthly trendlines for sales, distribution, pricing?

  • RAI: Yes :- we have continuous monthly time series data for each category
  • SORT: No :-  we produce snapshots data based on client requests but they are not continuous

14. Do you have audit forms/APP with SKU‑level fields?

  • RAI: Yes :- we have a structured audit forms in the form of an APP
  • SORT: Maybe Yes :-  but mostly in the form of observation checklists only.

15. Do you validate data using store-level reconciliation (stock vs sales)?

  • RAI: Yes : for RAI, reconciliation is mandatory.
  • SORT: No :- nothing to reconcile but may do some data checks

16. Can your data support econometric modelling (price elasticity, distribution elasticity)?

  • RAI: Yes :- because we have quantitative inputs and continuous monthly data.
  • SORT: No :- insufficient data depth or gaps in the data

17. Can we use the data for Brand Coverage Analysis and Assessment?

  • RAI: Yes :- we have continuous monthly sales data for each category and brand as well as manufacturers
  • SORT: No :- Data gaps, insufficient data for Brand Coverage Analysis

How to Use These Questions in Practice for Assessment

Ask these questions in a sequence. If the provider fails any of the first five, they are not a Retail Audit measurement Index (RAI) provider.

If they fail some of any of these questions: 1, 3, 4, 5, 6,10 they are 100% SORT provider

If they fail any of the following questions: 5, 10, 15 and 16, they are trying to sell Store Observation Retail Tracking (SORT) as Retail Audit Measurement Index (RAI)

If they pass all the 17 questions, they are a Full  Retail Audit Measurement Index (RAI) provider comparable to SumsureIQ’s sRetailIQ or Nielsen’s RMS.

Follow SumsureIQ for more discussions on the FMCG sector and Market Research Methodologies

SumsureIQ is a full service market research agency. We provide a variety of market research products based on robust econometric, mathematical and statistical approaches. In Ghana, SumsureIQ is the only research agency or company providing monthly Retail Audit Measurement Index (RAI) as standard.

Our main product is Retail Audit Measurement Index (RAI) for which we have monthly data from January 2022 to date for over 75 segments/categories. From 10 retail channels (including Modern Trade and Petrol Marts) across all the 16 regions in Ghana. We also provide Retail Store Observations Retail Tracking (SORT). However, these are bespoke researches based on client specifications/requirements and objectives. For more details on our services and product range, visit our website at www.sumsureiq.com

Are you a manufacturer/Retailer, a stakeholder or a player in the FMCG market in any African country? Are you leveraging real-time retail insights to scale your business for growth?

If you wish to leverage real-time retail audit data to improve your categories and brands share performances, SumsureIQ (www.sumsureiq.com) is ready to have a discussion with you.

Please visit our website and contact us: www.sumsureiq.com

#FMCG #FMCGSector #sRetailIQ #sConsumerIQ #sConsultancyIQ #SumsureIQ #ExchangeRates #GhanaFMCG #Prices

Why do most people confuse Retail Audit Measurements Index (RAI) with Store Observation Retail Audit Tracking (SORT) Market Research Results? 

Most people confuse Retail Audit Measurement Index (RAI) with Store Observation Retail Audit Tracking (SORT) research methodologies and outcomes because, on the surface, both involve “going to stores and collecting data.”

But underneath, they are fundamentally different research methodological approaches or systems and they produce different outcomes and results. The confusion comes from 8 predictable reasons that show up repeatedly in Ghana’s and most African countries’ Fast Moving Consumer Goods (FMCG) ecosystems.

Here is the clearest breakdown of the confusion:

  1. Both activities happen in stores/outlets — So people “Assume” they are the same

To the untrained eye, a field auditor with a tablet and a sales representative with a checklist look identical. Because to them, both are:

• Visiting stores/outlets
• Checking products
• Recording information

This creates the illusion that they are doing the same job, even though the purpose, sampling, and Key Performance Indicators (KPIs) are completely different.

  1. Many companies do not train their research or market intelligence teams on the differences

In Ghana and some Africa countries, most FMCG companies:

• Mostly train sales teams on execution tracking
• But do not train them on market measurement methodology

So Business Owners, Sales Representatives, Trade Marketers and even some very Senior Managers assume, for example:

“If I checked 20 stores and saw my products in at least 18 of them, then my numeric distribution is high.”

This is methodologically incorrect and wrong, but it feels intuitive—so the confusion persists and people do not want to correct it.

  1. Store observations produce numbers — and some people mistake numbers for measurement

Store observation tracking generates numbers like:

• Availability: 80%
• Price compliance: 70%
• Shelf presence: 60%

Because these look like “KPIs,” people assume they are market KPIs. But they are execution KPIs, not market measurement KPIs.

This analogy and mistake is like confusing, for example:

A blood pressure check results

with

A full medical examination results

Both involve numbers, but only one is diagnostic.

  1. Lack of understanding of sampling and representation of the universe or the population

This is the biggest technical reason. Because, most people do not understand:

• Representative sampling
• Weighting
• Projection
• Channel stratification
• Statistical confidence level
• Relative Standard Errors (RSA)
• And other technical complexities

So they assume:

“If I saw my brand in 10 stores, it must be true for all the stores and therefore, the whole market.”

Retail Audit Measurement is built on Statistical Science. Store Observation Tracking is built on “convenience” sampling.

Because the sampling logic is invisible, people collapse the two into one.

  1. Consumer, Market Intelligence and Sales/Marketing Teams often use observation data to “Make Strategic” claims

This is where the confusion becomes dangerous.

Sales teams often say things like:

“Our distribution is 90%.”
“Competitor X is losing share.”
“Our price is stable across the market.”

But these statements are based on store observations, not market measurement.

When Business Owners, CEOs and Senior Managers hear these statements repeatedly, they start believing that “Store Observation = Retail Audit”. But they are never the same.

  1. The phrase “Retail Audit” misleads some people

Both methods/terms contain the words “retail audit”, which creates semantic confusion. In fact,

“Retail Audit Measurement” = market measurement and execution
“Store Observation Retail Audit Tracking” = execution monitoring

Because the phrase “retail audit” appears in both, people assume they belong to the same methodological family. But RAI is based on robust statistical and mathematical sciences whilst SORT is based on intuition.

  1. Some Research Agency/Companies or Firms market store Observation as “Retail Audit”

Especially, in some emerging markets like Ghana and other African countries, some research companies sell only store observations, but they label them as “Retail Audit” to appear competitive with specialised and recognised research agencies like SumsureIQ or NielsenIQ.

This pollutes the terminology in the industry.

  1. Business Owners, CEOs and Senior Managers want “Fast Data” — and Store Observation is “Fast data”

Retail Audit Measurement is:

• Slower but provides full view of the market
• More expensive and huge initial investment required
• More complex and scientific

Store Observation is:

• Fast but not full view of the market
• Cheap and required low initial investment
• Easy and intuition based

Because of these, some CEOs and Senior Managers often prefer the simpler method and unconsciously elevate it to the status of a Full Retail Audit.

CONCLUSION

In conclusion, the non-obvious insight is that people confuse the two because they confuse “seeing” with “measuring.” Store observation is “seeing”. Retail audit is “measuring”. Seeing feels intuitive. Measuring requires mathematical and statistical discipline and understanding of the complex nature of the FMCG universes. Lastly, Store observation is cheap and Retail Audit is more expensive and most people are price sensitive and may ignore the complex outcome for cheap results. That is why the confusion persists.

Follow SumsureIQ for more discussions on the FMCG sector.

SumsureIQ is a full service market research agency. We provide a variety of market research products based on robust econometric, mathematical and statistical approaches. In Ghana, SumsureIQ is the only research agency or company providing monthly Retail Audit Measurement Index (RAI) as standard.

Our main product is Retail Audit Measurement Index (RAI) for which we have monthly data from January 2022 to date for over 75 segments/categories. From 10 retail channels (including Modern Trade and Petrol Marts) across all the 16 regions in Ghana. We also provide Retail Store Observations Retail Tracking (SORT). However, these are bespoke researches based on client specifications/requirements and objectives. For more details on our services and product range, visit our website at www.sumsureiq.com

Are you a manufacturer/Retailer, a stakeholder or a player in the FMCG market in any African country? Are you leveraging real-time retail insights to scale your business for growth?

If you wish to leverage real-time retail audit data to improve your categories and brands share performances, SumsureIQ (www.sumsureiq.com) is ready to have a discussion with you.

Please visit our website and contact us: www.sumsureiq.com

#FMCG #FMCGSector #sRetailIQ #sConsumerIQ #sConsultancyIQ #SumsureIQ #ExchangeRates #GhanaFMCG #Prices

Real Reasons Why Some FMCG Products “Do Not Move” in Ghana

Further to Bright Alorwoyie post on the discussions of the above topic in LinkedIn and the subsequent comments by Dr Erasmus L Owusu, PhD thereafter, SumsureIQ would like to expatiate the topic based on evidence from our Field Data Collection, Insights and Reports.

Summary:

Based on SumsureIQ monthly retail audit and consumer insight patterns, the FMCG products that “do not move” in Ghana typically fail because of distribution gaps, mis-aligned pricing/pack architecture, weak brand equity, poor channel strategy, and low consumer relevance. These are the recurring structural reasons visible across SumsureIQ’s sRetailIQ and sConsumerIQ datasets and reports.

Below is a structured, evidence‑based breakdown aligned with how SumsureIQ diagnoses under-performance.

1. Distribution Failure (The #1 reason products do not move)

SumsureIQ’s retail audit data consistently shows that availability and numeric and weighted distributions are the strongest predictors of FMCG sales in Ghana. Products often fail not because consumers reject them, but because they never reach enough outlets.

Key patterns:

  • Low numeric distribution in Traditional Trade, which still accounts for the majority of FMCG volume.
  • Weak penetration in high‑velocity channels (e.g., tabletop kiosks, Open Market, Groceries and Mini shops,  Semi-Retailers, Hawkers and others).
  • Poor last‑mile execution like out-of-stock, inconsistent supply, or irregular delivery cycles.
  • Over‑reliance on Modern Trade for promotion, which contributes a small share of national/total country FMCG volumes.

SumsureIQ repeatedly emphasises that brands must “track performance and distribution across Ghana” because distribution gaps are the most common cause of under-performance.

2. Wrong Pricing and Pack-Size Architecture

SumsureIQ’s 2025 data shows premiumisation, but also persistent cost‑of‑living pressures. Products fail when their pricing does not match Ghanaian value perception.

Typical issues:

  • Price points above key psychological thresholds (GHS 1, GHS 2, GHS 5, GHS 10).
  • Pack-sizes that do not match daily cash‑flow realities (e.g., only offering large packs in a sachet‑driven market).
  • Failure to adjust prices during inflationary spikes, causing consumers to switch to cheaper substitutes.
  • Mis-match between value proposition and price premium, especially in beverages and non-food categories.

3. Weak Brand Equity or Low Consumer Trust

SumsureIQ’s consumer panel (sConsumerIQ) shows that Ghanaian consumers are brand‑loyal in food staples but value‑driven in beverages and non-foods.

Products under-perform when:

  • They lack recognition or heritage in categories dominated by legacy brands (e.g., Alamo, Club Beer, Gino, Maggi, Fanice, Onga, Ideal, Coca-Cola, Tasty Tom, Frytol, Voltic and others).
  • Packaging looks unfamiliar or “foreign” or even poor in a way that reduces trust.
  • They fail to communicate functional benefits clearly (e.g., taste, aroma, efficacy, nutrition).

In categories like rice, edible oil, milk, and tomato mixes where SumsureIQ reports strong growth, brands with weak equity simply get ignored.

4. Poor Channel Strategy (Mis-allocation of effort)

SumsureIQ’s retail audit insights show that channel performance varies sharply across Ghana. Products fail when they are pushed into the wrong channels.

Common mistakes:

  • Focusing on Modern Trade/Supermarkets while ignoring Open Market, Mini Stores and Traditional shops.
  • Under-investing in Petrol Marts, which are high‑margin impulse channels.
  • Ignoring regional channel differences – e.g., Northern Ghana’s strong demand for certain food staples compared to the Southern parts.
  • Not tailoring SKUs to channel realities (e.g., large bottles in kiosks where sachets dominate).

SumsureIQ explicitly lists “channel performance diagnostics” as a core use case because mis-aligned channel strategy is a major cause of low movement.

5. Mis-aligned Product-Market Fit

Some products simply do not match Ghanaian consumption behaviour.

Examples from SumsureIQ category trends:

  • Non-Food categories (e.g., home care, personal care) grew the slowest in 2025. Products in these categories struggle unless they offer strong value.
  • Non-Alcoholic Beverages saw only modest volume growth; new entrants struggle unless they differentiate strongly.
  • Alcoholic beverages grew in value but not volume relatively – meaning consumers are buying better, not more. New low‑equity brands get squeezed out.

Products fail when they:

  • Do not solve a real consumer problem.
  • Enter saturated categories without differentiation.
  • Offer benefits consumers do not prioritise.

6. Competitive Pressure from Dominant Players

SumsureIQ’s 2025 data shows that over 60 manufacturers control 75% of FMCG value sales – a highly competitive landscape.

Products fail when:

  • They compete directly with entrenched brands (e.g., Alamo, Club Beer, Gino, Maggi, Fanice, Onga, Ideal, Coca-Cola, Tasty Tom, Frytol, Voltic and others).
  • They lack marketing support to break through clutter.
  • Competitors out-spend them in trade promotions and visibility.

7. Lack of Continuous Measurement & Strategy Adjustment

SumsureIQ emphasises that brands must track “What is happening? Why is it happening? What should we do next?”

Products fail when Company Executives, Marketing and Sales Directors and Brand Managers

  • Do not monitor monthly retail audit trends.
  • Do not use 360 degrees FMCG Market Research Data and insights like SumsureIQ data.
  • Do not adjust pricing or distribution quickly.
  • Do not test pack-sizes or promotions.
  • Do not assess the Return-on-Investment (ROI) after promotion
  • Do not benchmark against competitors.

This is why SumsureIQ positions itself as the “IQ behind the data” – to support and prevent exactly these failures.

Conclusion: The Real Reasons FMCG Products “Do not Move” in Ghana are:

  1. Distribution gaps (most common).
  2. Wrong pricing/pack architecture.
  3. Weak brand equity.
  4. Poor channel strategy.
  5. Mis-aligned product-market fit.
  6. Strong competitive pressure.
  7. Lack of continuous measurement and adjustment.

Follow SumsureIQ for more discussions on the FMCG sector.

Are you a manufacturer/Retailer, a stakeholder or a player in the FMCG market in any African country? Are you leveraging real-time retail insights to scale your business for growth?

If you wish to leverage real-time retail audit data to improve your categories and brands share performances, SumsureIQ (www.sumsureiq.com) is ready to have a discussion with you.

Please visit our website and contact us: www.sumsureiq.com

#FMCG #FMCGSector #sRetailIQ #sConsumerIQ #sConsultancyIQ #SumsureIQ #ExchangeRates #GhanaFMCG #Prices

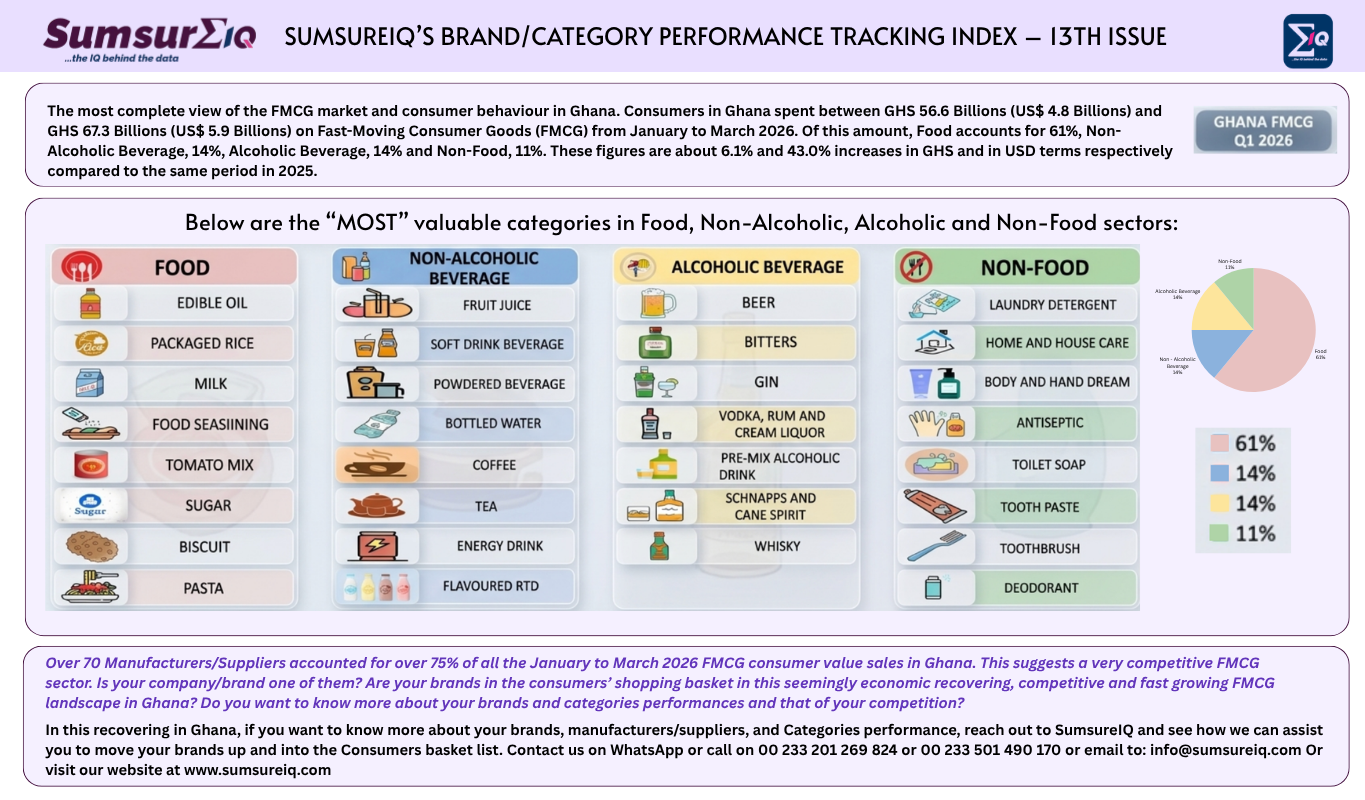
SumsureIQ Quarterly TOP 10 FMCG BRAND/CATEGORY PERFORMANCETRACKING INDEX – 13th Edition

SumsureIQ Quarterly TOP 10 FMCG BRAND/CATEGORY PERFORMANCE TRACKING INDEX – 13th Edition

SumsureIQ, the IQ Behind the data is equal to FMCG MARKET REASERCH across African Countries. Thus, SumsureIQ has the most complete view of the FMCG market and consumer behaviour in Ghana.

Consumers in Ghana spent between GHS 55.6 Billions (US$ 4.8 Billions) and GHS 67.3 Billions (US$ 5.9 Billions) on Fast-Moving Consumer Goods (FMCG) from January to March 2026.

These figures are about 6.1% and 43.0% increases in GHS and in USD terms respectively compared to the same period in 2025.


Of this amount, Food accounted for 61% (an increase of 1% point compared to the same period in 2025), Non-Alcoholic Beverage, 14% (a drop of -1% point compared to 2025), Alcoholic Beverage, 14% (an increase of 2% point compared to the same period in 202%) and Non-Food, 11% (a drop of -2% point compared to 2025).

These figures would suggest that, spending on Food products as a proportion of the total FMCG spending has increased.

This may further suggest that cost of living pressures are sticky, though,
improving. The Food Sector represents the main driver of growth in the FMCG Market in Ghana.


Here are the TOP 10 most performing and popular brands consumers mostly selected at Point-of-Sale (POS) by in store Transaction numbers in Q1 2026 (January to March 2026).

  1. FOOD:
    ONGA, MAGGI, IDEAL, REMIE, NIDO, INDOMIE, CARNATION, KIVO, SANKOFA and FRYTOL
  2. NON-ALCOHOLIC BEVERAGE:
    VERNA, VOLTIC, COWBELL, BIGOO, BEL-AQUA, AWAKE, COCA-COLA, MILO, MIKSI and MALTA GUINNESS
  3. ALCOHOLIC BEVERAGE:
    CLUB, STRIKER, GUINNESS, STAR, ORION, ABC, ORIJIN, GULDER, EAGLE and CASTLE BRIDGE
  4. NON-FOOD:
    MADAR, JAMAA, PEPSODENT, VIP, KLEESOFT, YAZZ, COLGATE, DAY-BY-DAY, SUNLIGHT and KEY SOAP

The data also show that over 70 Manufacturers/Suppliers accounted for more than 75% of all the January to March 2026 FMCG consumer value sales in Ghana compared to over 40 in the same period in 2025.

This suggests a very competitive and growingmarket with several new entrants into the FMCG sector in a recovering economic landscape in Ghana. In general, SumsureIQ data may suggest that the Ghanaian economic landscape has improved and has become more competitive.

This is therefore, a sign of economic recovery and stability in Q1 2026. But there is caution due to the US/Isreal and Iran War as it may have some economic impacts.


Questions?
Are your brands in the consumers’ shopping basket in this seemingly economic recovery landscape in Ghana? Do you want to know more about your brands and categories performance and that of your competition?


Are you a manufacturer, a supplier, a stakeholder or a player in the FMCG market in any African country? Are you leveraging real-time retail insights to scale your business for growth?


If you wish to leverage real-time retail audit data to improve your categories and brands performances, SumsureIQ is ready to have a discussion with you.


Contact us by visiting our website at www.sumsureiq.com

FMCGMarkertResearch #GhanaFMCG #SumsureIQ #RetailAudit #sRetailIQ #sConsumerIQ #sConsultancyIQ #MarketResearch

RetailTrends #BrandPerformance #CategoryPerformance #AfricaMarketResearch #AfricaFMCG

What are the possible impacts of the US/Israel – Iran War on Fast-Moving Consumer Goods (FMCG) Consumption in Ghana?

What are the possible impacts of the US/Israel – Iran War on Fast-Moving Consumer Goods (FMCG) Consumption in Ghana?


Introduction
The US/Israel – Iran War could have significant impacts on the FMCG sector in Ghana. Fast-Moving Consumer Goods (FMCG) such as food items, beverages, toiletries, and household essentials form the backbone of daily consumption in Ghana.

However, global geopolitical conflicts can significantly influence the demand and affordability of these products. The US/Israel – Iran war could trigger major economic ripple effects worldwide, particularly through rising energy prices and supply chain disruptions. For an import-dependent economy like Ghana, these developments could directly influence FMCG consumption patterns.


Rising Oil and Fuel Prices and Inflation
One of the most immediate consequences of a U.S/Israel – Iran War is the disruption of global oil supply chains. This would likely lead to a surge in global oil prices. The Middle East is a critical hub for global oil supply, and disruptions in the region, especially around the Strait of Hormuz, which carries about 20 percent of global oil shipments, can quickly drive prices upward. This would likely affect the prices of FMCG goods.


Analysts have warned that oil prices could spike sharply if supply routes are disrupted, with some forecasts suggesting prices could reach extremely high levels in severe scenarios. For Ghana, this is particularly significant because the country imports a large share of its refined petroleum products despite being an oil producer. As a result, increases in global oil prices quickly translate into higher domestic fuel costs.


Higher fuel prices raise transportation and production costs across the economy, leading to inflationary pressures. These inflation pressures would affect almost all consumer goods, especially FMCG products.


Higher Transportation and Distribution Costs
FMCG products rely heavily on efficient logistics networks to move goods from manufacturers to wholesalers and retailers. In Ghana, transportation costs form a major component of the final retail price of goods.


When fuel prices rise, transport operators increase fares and freight charges. Agricultural goods transported from rural farming areas to urban markets also become more expensive.
Consequently, distributors and retailers pass these increased costs onto consumers, making everyday products such as cooking oil, rice, beverages, soap, and packaged foods more expensive.Declining Consumer Purchasing Power


Declining Consumer Purchasing Power
Inflationary pressures will lead to increase in the level of Inflation and that will reduce the real income of households. When Ghanaians spend more money on transportation, fuel, and utilities, they have less disposable income available for other purchases.


This often leads to shifts in FMCG consumption patterns, including:
Reduced spending on premium or branded products

Increased demand for cheaper alternatives or smaller package sizes

Greater focus on essential and life necessity goods rather than discretionary items

In Ghana, where many households already operate within tight budgets, such changes can significantly affect FMCG sales volumes.


Pressure on Import Costs and the Ghanaian Cedi
Rising oil prices also increase the demand for foreign currency, since Ghana uses U.S. dollars and other foreign currencies to import fuel and other goods. This can put pressure on the Ghanaian cedi and widen the trade deficit.


A weaker cedi makes imported FMCG products even more expensive. Since a significant portion of packaged foods, raw materials, and consumer goods are imported, currency depreciation could further drive up retail prices.


Supply Chain Disruptions
A broader geopolitical conflict may also disrupt global shipping routes and manufacturing supply chains. Many FMCG products depend on imported raw materials, packaging materials, or finished goods.
If international logistics slow down due to the US/Israel- Iran War disruptions or higher shipping costs, Ghanaian retailers could experience:
tickedDelays in product deliveries

tickedTemporary shortages of certain FMCG items

tickedIncreased wholesale price


Such supply constraints could reduce product availability while simultaneously raising prices.

Potential Economic Opportunities for Ghana
Despite these risks, there could be limited economic benefits for Ghana. As a crude oil exporter, Ghana may earn higher export revenues if global oil prices rise significantly.


Higher government revenue from oil exports could provide fiscal space to support the economy or stabilise prices, though such benefits may take time to translate into consumer relief and into consumers pockets.


Conclusion
The US/Israel – Iran War could have far-reaching consequences for Ghana’s FMCG sector and consumption. Rising oil prices would likely increase transportation costs, fuel inflation, and weaken consumer purchasing power. These factors could reduce demand for non-essential FMCG products while shifting consumption toward cheaper alternatives.


At the same time, currency pressures and global supply disruptions could further increase retail prices and strain supply chains. Although Ghana may benefit from higher crude oil export revenues, the overall short-term effect on FMCG consumption would likely be negative due to rising living costs and reduced disposable income.


In summary, geopolitical conflicts far from Ghana can still significantly influence everyday consumer behavior within Ghana, demonstrating the interconnected nature of the global economy.

Follow SumsureIQ for more discussions on the FMCG sector.

Are you a manufacturer/Retailer, a stakeholder or a player in the FMCG market in any African country? Are you leveraging real-time retail insights to scale your business for growth?
If you wish to leverage real-time retail audit data to improve your categories and brands share performances, SumsureIQ (www.sumsureiq.com) is ready to have a discussion with you.
Please visit our website and contact us: www.sumsureiq.com

FMCG #FMCGSector #sRetailIQ #sConsumerIQ #sConsultancyIQ #SumsureIQ #ExchangeRates #GhanaFMCG #Prices

Ghana’s TOP 30 Performing Fast Moving Consumer Goods (FMCG) Manufacturers/Suppliers in 2025.

SumsureIQ has the most complete view of the FMCG market and consumer behaviour in Ghana. Consumers in Ghana spent between GHS 295.0 Billion (US$ 23.6 Billions) and GHS 357.0 Billion (US$ 28.6 Billions) on Fast-Moving Consumer Goods (FMCG) from January to December 2025. These figures are about 41.8% and 65.6% increases in GHS and in USD terms respectively compared to the same period in 2024.

Of this amount, Food accounted for 58% (a drop of -1% point compared to 2024), Non-Alcoholic Beverage, 13% (a drop of -2% point compared to 2024), Alcoholic Beverage, 18% (an increase of +5% point compared to the same period in 2024) and Non-Food, 11% (a drop of -2% point compared to 2024).  These figures would suggest that, spending on Food products as a proportion of the total FMCG spending has reduced, leaving some more monies to be spent on other FMCG goods. This may further suggest less cost of living pressures. The Food Sector is still the main driver of growth in the FMCG Market in Ghana.

The data also show that over 60 Manufacturers/Suppliers accounted for more than 75% of all the January to December 2025 FMCG consumer value sales in Ghana compared to over 30 in the same period in 2024. This suggests a very competitive and several new entrants into the FMCG sector in a recovering economic landscape in Ghana. In general, SumsureIQ data may suggest that the Ghanaian economic landscape has improved and has become more competitive. This is therefore, a sign of economic recovery in 2025.

Below (in the slides) are Ghana’s TOP 30 top performing FMCG manufacturers/suppliers in 2025 as measured by consumer spending (i.e. amount of money consumers spent and the quantity consumed) on FMCG consumption were; in that order:

Questions?:

Are your brands in the consumers’ shopping basket in this seemingly economic recovery landscape in Ghana? Do you want to know more about your brands and categories performance and that of your competition?

Are you a manufacturer, a supplier, a stakeholder or a player in the FMCG market in any African country? Are you leveraging real-time retail insights to scale your business for growth?

If you wish to leverage real-time retail audit data to improve your categories and brands performances, SumsureIQ is ready to have a discussion with you.

Contact us by visiting our website at www.sumsureiq.com

#GhanaFMCG #SumsureIQ #RetailAudit #sRetailIQ #sConsumerIQ #sConsultancyIQ #MarketResearch #RetailTrends #BrandPerformance #CategoryPerformance #AfricaMarketResearch #AfricaFMCG