Cost-of-living crisis: High inflation and impact on the standard of living
Research by a Ghanaian market research company, SumsureIQ, indicates that the standard living for the average Ghanaian consumer has declined by 8%.
The post COVID pandemic period has seen myriads of economic challenges facing the ordinary consumer across the globe and notably in Ghana where the economic landscape is
characterised by historic high levels of inflation coupled with cost-of-living crisis. Inflation, cost of living and standard of living are interrelated and connected.
Whilst the cost of living is subjective and can be on individual basis, the average cost of living can be measured (e.g. monthly, half-yearly or yearly) for a group of people, especially in the same geographical area.
Ultimately, cost of living is a personal finance concept that measures how much in the local currency an individual or a household living costs are. Inflation on the other hand, is universal and is tied to a specific country.
It measures how the average prices of goods and services changes for everyone with time.
This means that high levels of inflation could lead to costs of living crisis for most consumers, although this is not a direct relationship as inflation affects each individual and group of people differently.
Prices of such vegetables on the market consistently go up
When prices rise for goods and services, high levels of inflation always push up someone’s costs of living. This means that when prices rise for selective or elective spending (like spending on automobiles, washing machines, fridges/freezers, holidays and hobbies), people will often balance their lifestyle choices with cost-cutting actions.
In the end, consumers will always adjust to rising cost of living and hence, reducing their standard of living, if there are no equivalent or simultaneous increases in the purchasing power of their incomes.
In essence, a monthly living wage is a reasonable measure of cost of living. A monthly living wage is the average level of wage required by a person in a country to be able to afford a basic but decent living standard every month.
In Ghana, the average level of living wage in Urban and Peri-Urban areas was estimated to be GHS 2,922 in 2023 by Global Living Wage Coalition (https://www.globallivingwage.org/countries/ghana/).
This was worth about US$ 266 of goods and services in 2023. Economists at SumsureIQ estimate that, the average monthly living wage in the first half of 2024 to be about GHS 3,682.
This equates to an average increase of about 26% on the 2023 level. However, it is now worth US$ 245 of goods and services. Due to the fact that the economy of Ghana is import dependent, this may suggest a decline in the average Ghanaian living standard by about 8% in January to June 2024 compared with the same period in 2023.
Basically, what this means is that, if in the first half of 2023, the average consumer could buy 100 units of consumable goods and services in order to have a reasonable and decent living standard, in the first half of 2024, they could only buy 92 units of such goods and services.
Consumers’ standard of living is mainly due to a combination of the high levels of inflation and the fast depreciating Ghanaian Cedi vis-a-vis the major foreign currencies like the US dollar and compounded by the fact that, the Ghanaian economy is highly import dependant.
Using household consumption expenditure of FMCG per an adult as a measure of living standards
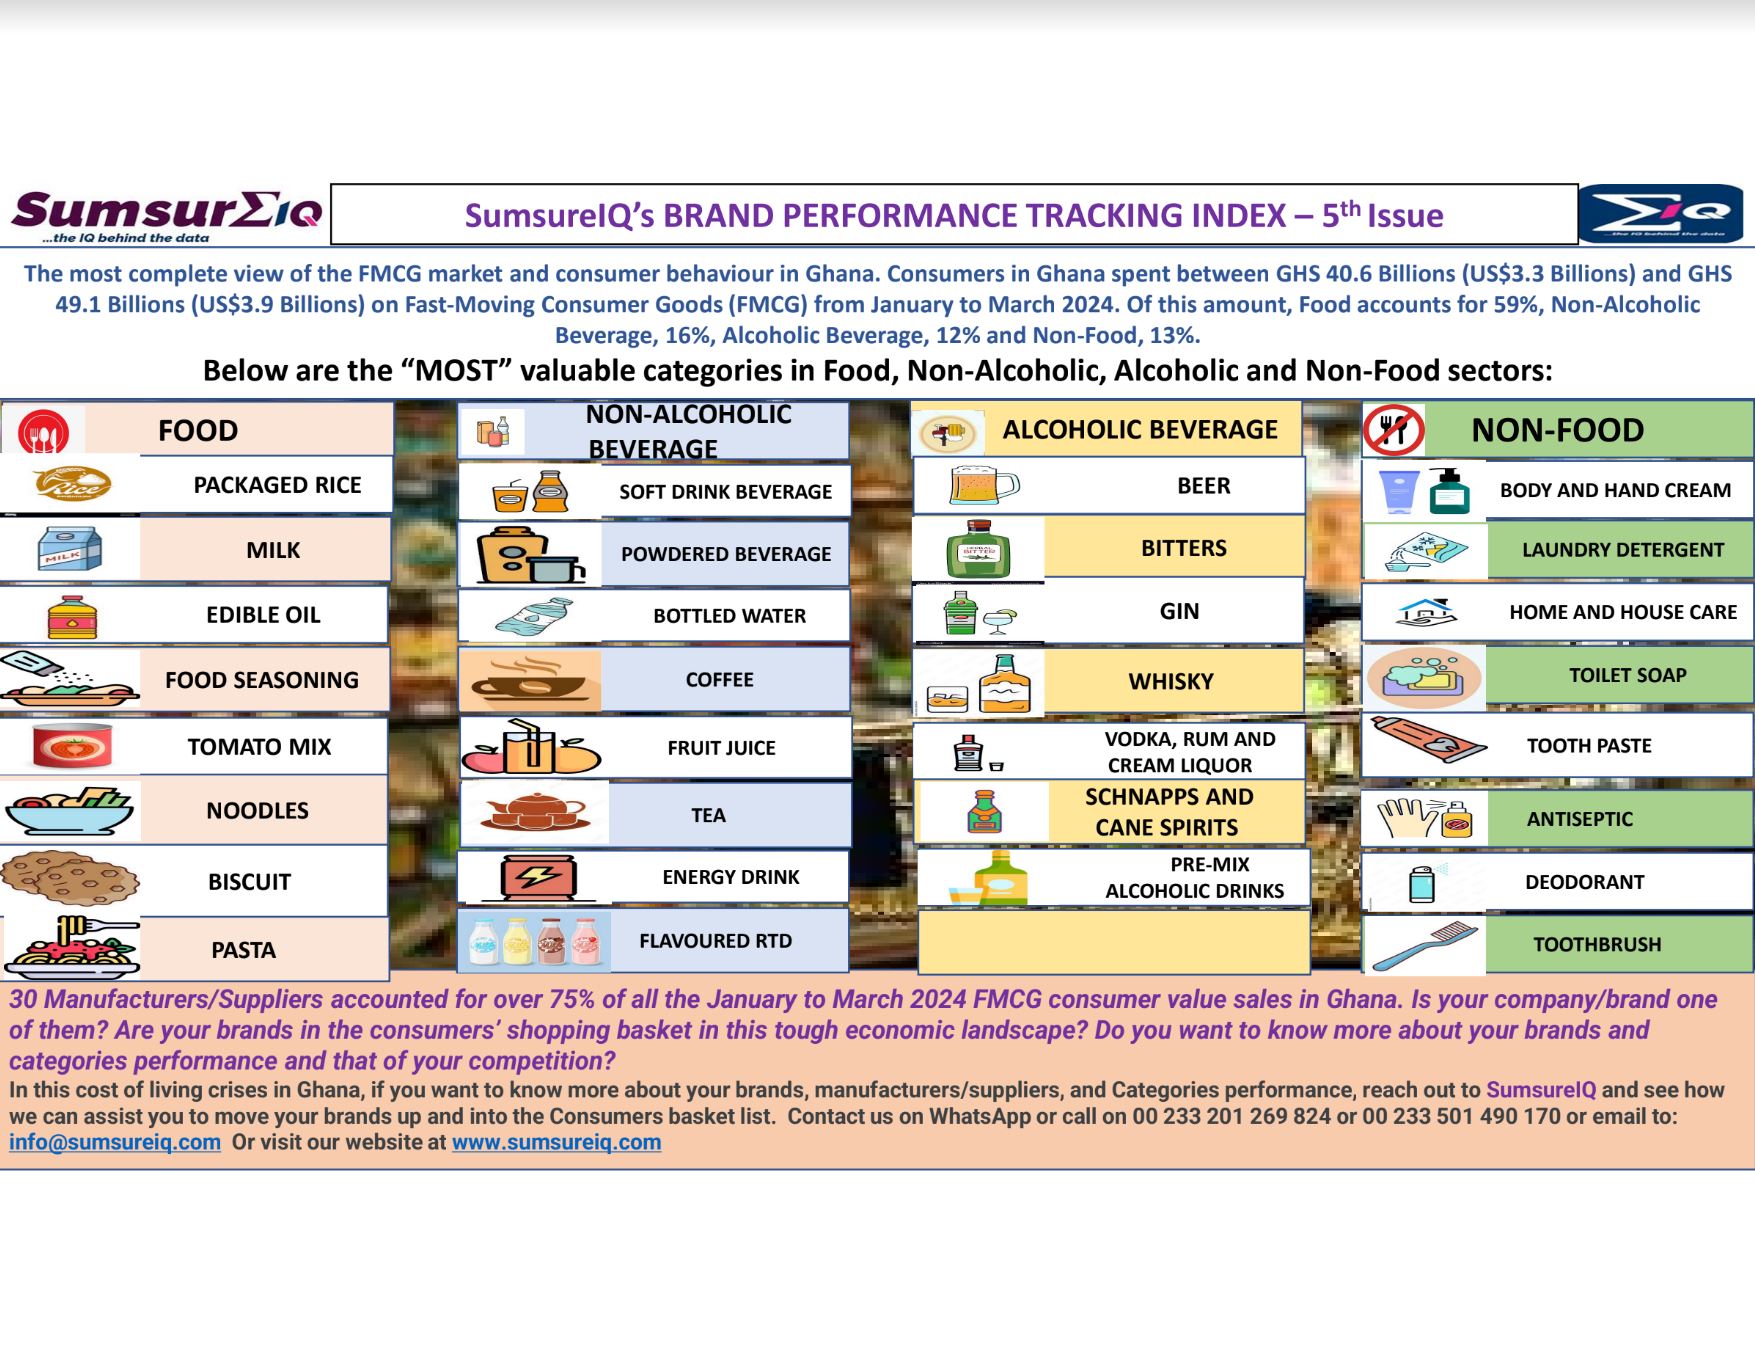
They found, that consumption of FMCG is generally flat with categories like Rice, Edible Oil, Food Seasoning, Ice Cream, Noodles and Pasta declining. This may suggest that Ghanaian consumers are reducing the quantity and volume of food they consume, even though food accounts for an increasing proportion of their FMCG consumption.
On the other hand, the SumsureIQ team, noticed that Ghanaian consumers are increasing the consumption Non-Alcoholic Beverages like Bottled Water, Powdered Beverage and Tea.
However, they are decreasing the consumption of Soft Drink Beverage, Energy Drinks and Fruit Juice.
This may suggest that consumers are substituting expensive categories with less expensive and essential for life categories as part of the adaptation process.
According to the Founder and the CEO of SumsureIQ, Dr Erasmus L Owusu, “even though in Ghana, FMCG accounts for over 50% of the average consumer’s basket of goods and services, household consumption expenditure of FMCG is an excellent indicator or measure of standard of living.
Furthermore, due to high levels of inflation, across board, it is most likely that less quantities will be consumed of other goods and services like Recreation,
Sport, Culture, Clothing and Footwear, Information and Communication Services and Insurance and Financial Services compounding and accelerating the decline in overall standard of living of the average Ghanaians consumer”.
Source: SumsureIQ (www.sumsureiq.com) is a full market research agency and consultancy based in Ghana and we collect over 100,000 lines of data each month on over 70 categories and segments of Fast-Moving Consumer Goods (FMCG) in Food, Non-Food, Alcoholic and Non- Alcoholic Beverages across all the 16 administrative regions and 10 channels/store-types in Ghana.
This amount of data shows that SumsureIQ has the complete view of the FMCG retail market structure, volume of consumer consumption and consumer behaviour in Ghana.